RESEARCH REPORTS01
23 DAYS AGO
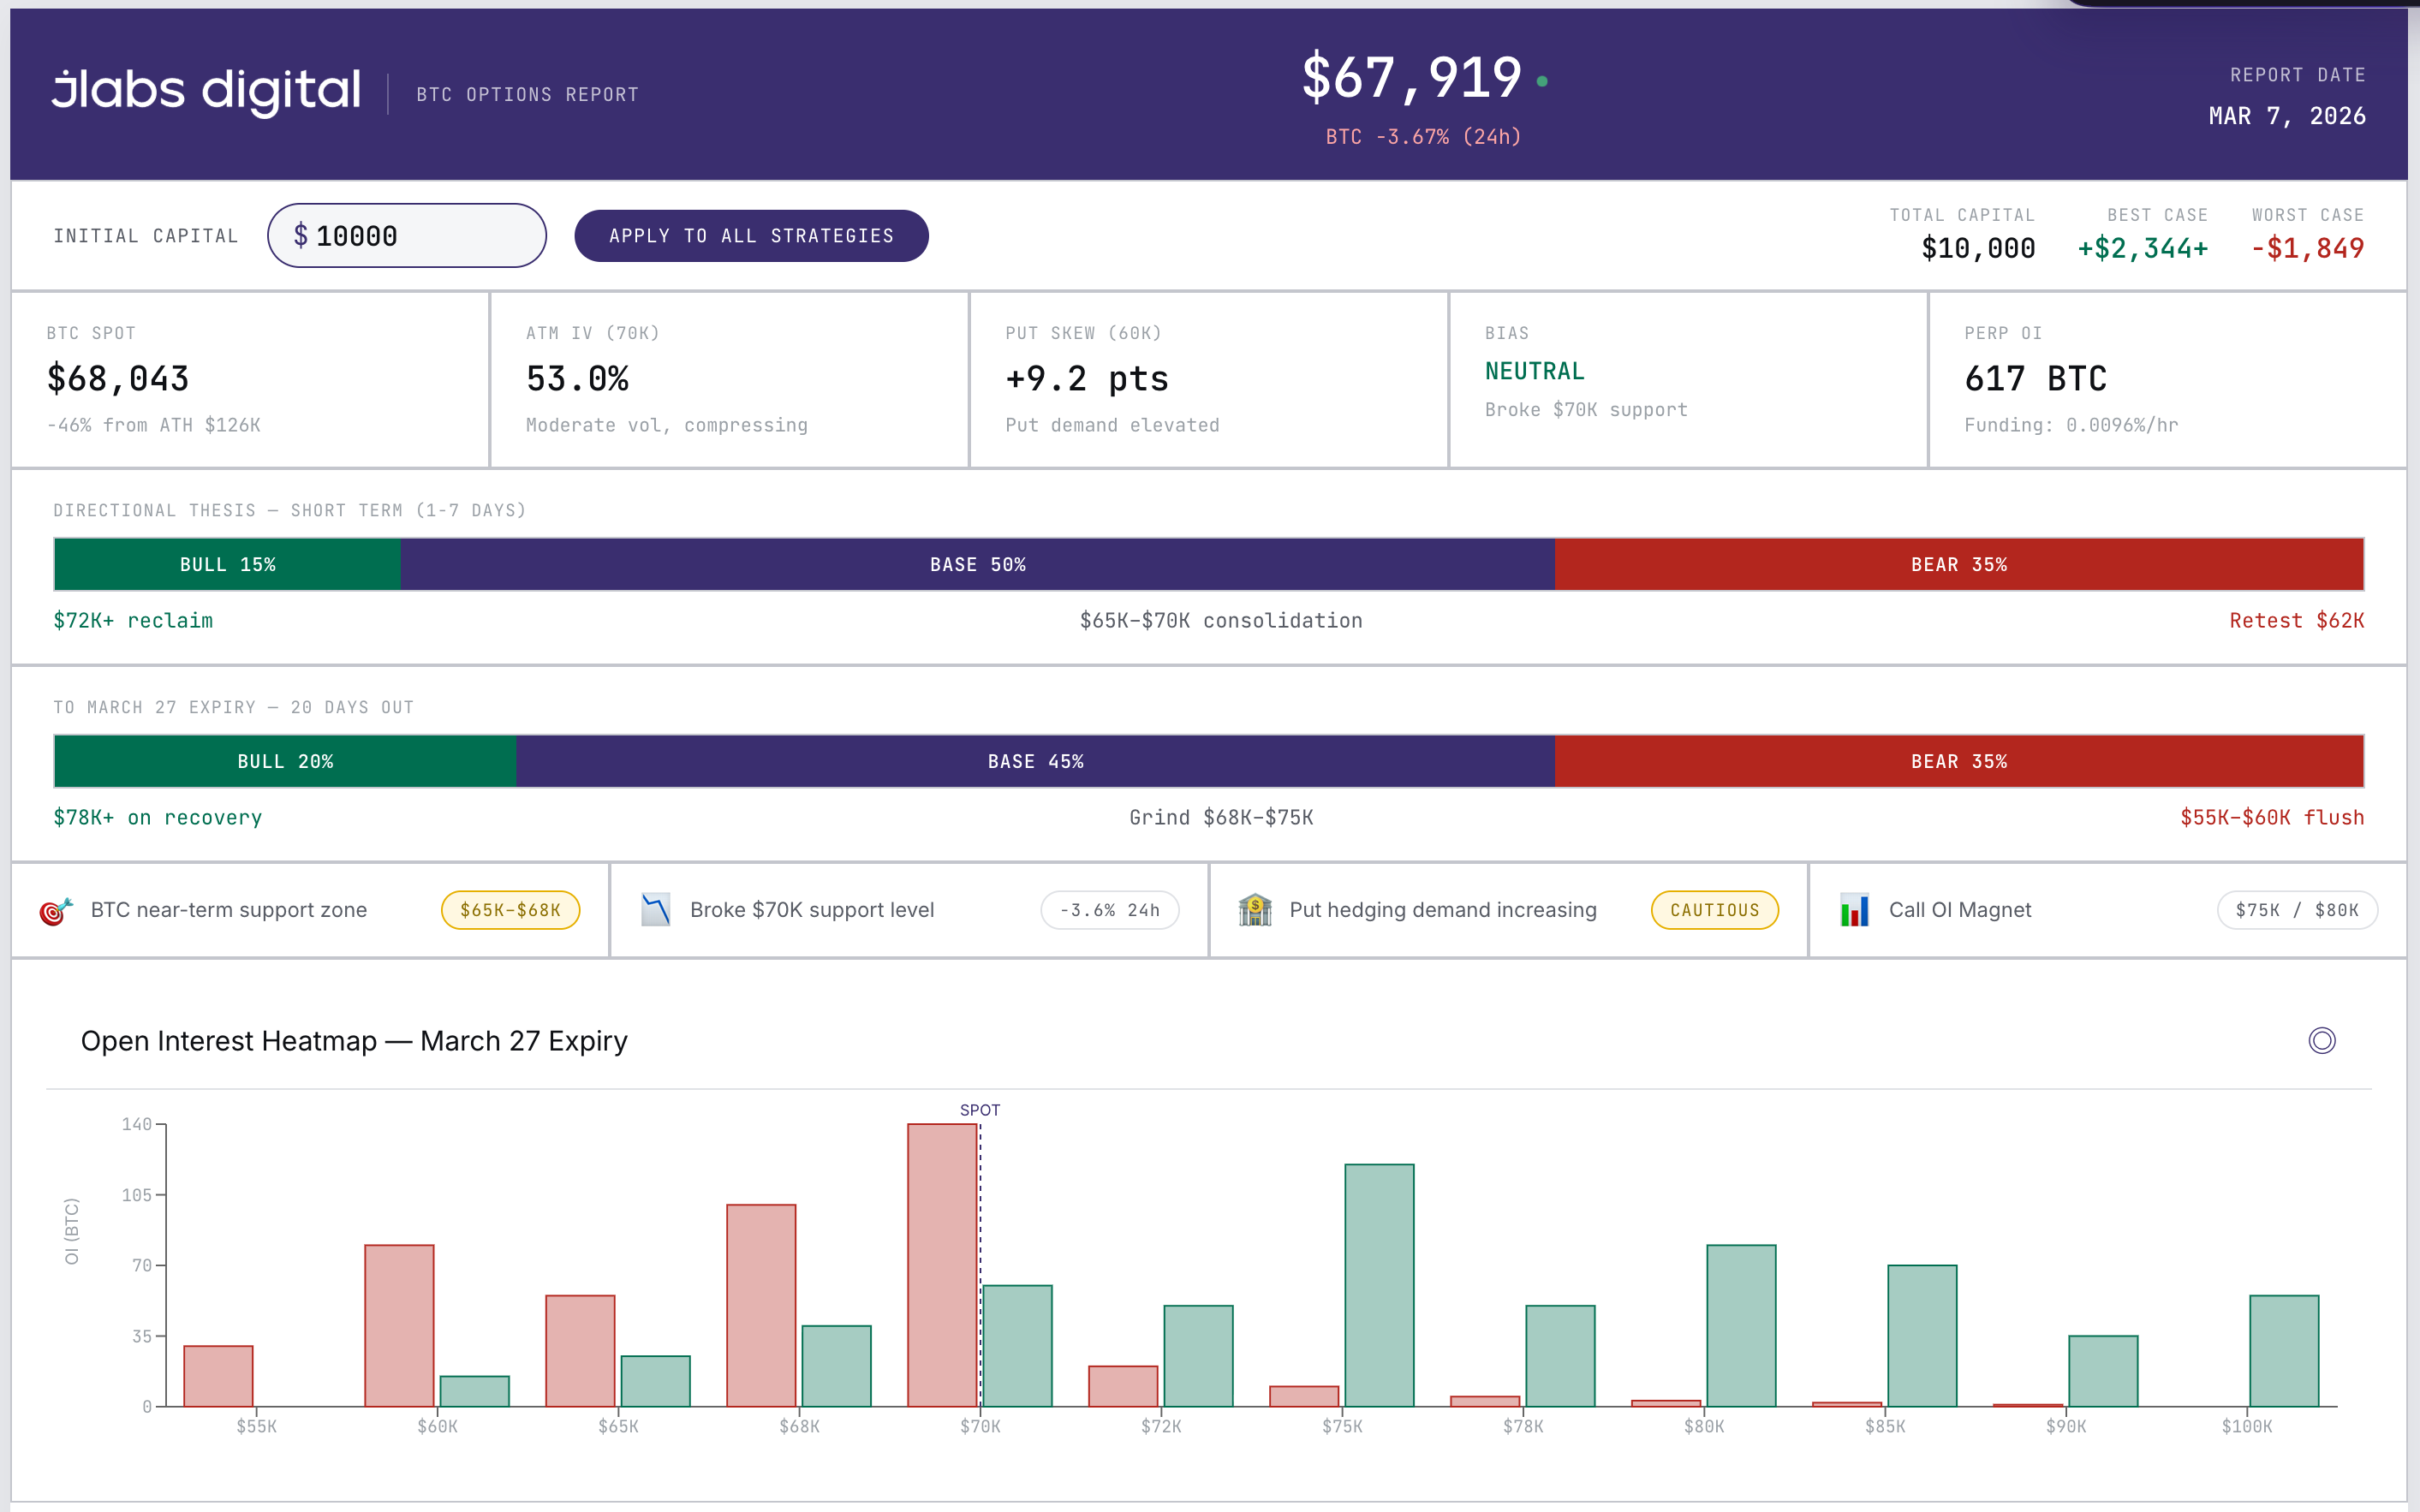
BTC Options Strategy Report
5 institutional-grade BTC options strategies with interactive payoff charts, P&L simulators, and portfolio scenario matrix. BTC at $68,043 with 20 DTE to March 27 expiry.
UPCOMINGSOON
More reports coming soon
Impact Market reports will expand beyond BTC options into broader market intelligence, prediction markets, derivatives structure, and cross-signal trade frameworks.
Stay Updated
Get notified when the next report drops
Follow the public channels for report releases and join the community for discussion around upcoming research.